Every day, journalists, marketers, and the merely curious open Google Trends to see what the world is searching for. And every day, a lot of them misread what they’re looking at — treating a relative index as a raw count, or mistaking a one-hour blip for a movement.
Here’s what the numbers actually mean, and how to tell a genuine story from statistical noise.
Key Takeaways
- Google Trends never shows raw search counts — the 0–100 score is a relative index, where 100 is that term's peak in that time range and region.
- The Trending Now feed ranks acceleration rather than volume, which is why a small term can out-trend an enormous one.
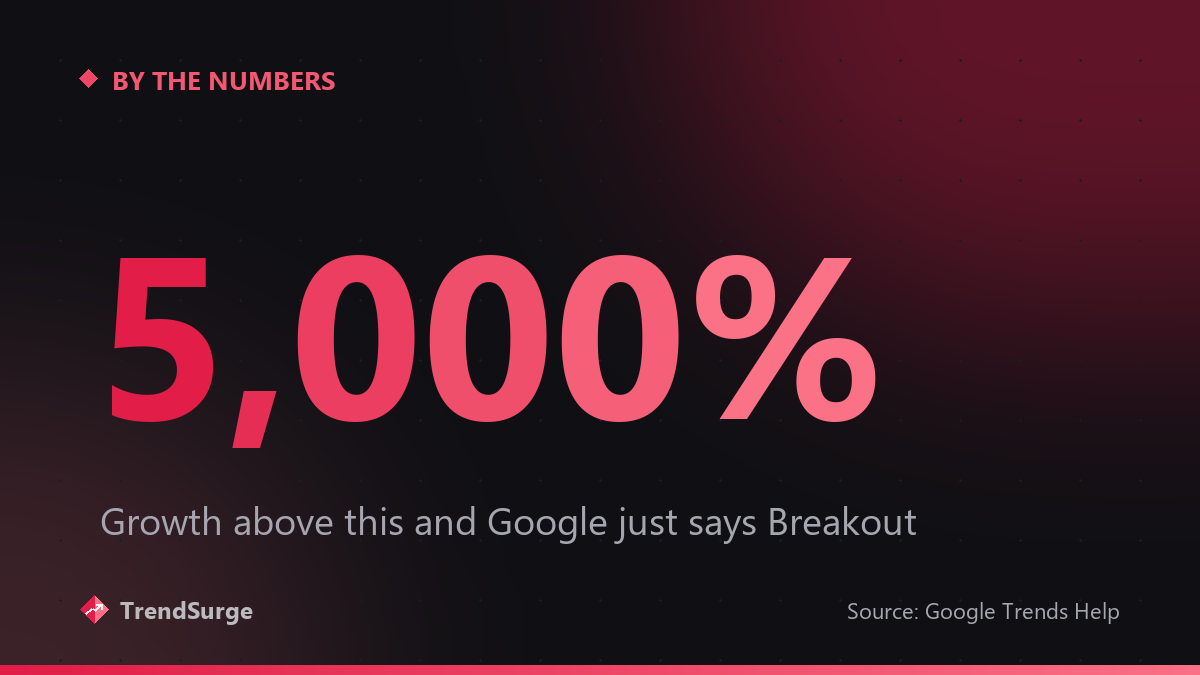
- A percentage jump is meaningless without its base: "Breakout" just means growth of more than 5,000%, usually from close to zero.
- Treat a spike as a story only if it sustains, spreads across regions, is explained by related queries, and is corroborated elsewhere.
The number isn’t a search count
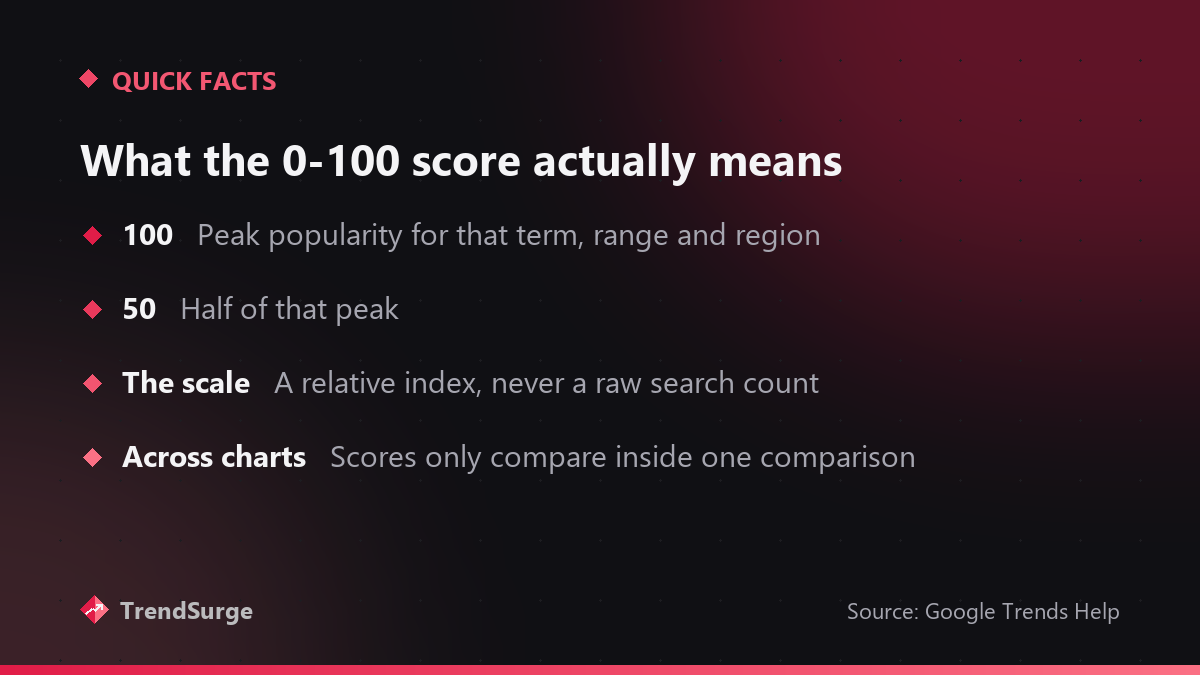
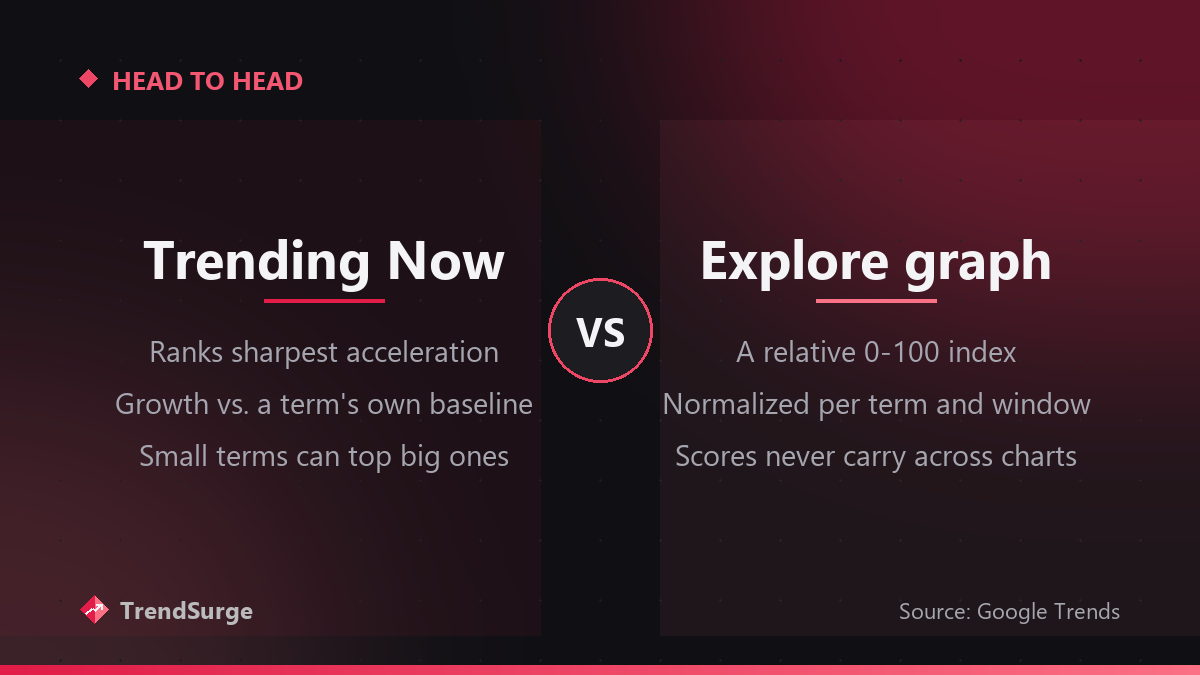
The most important thing to understand: Google Trends never shows you how many people searched for something. The 0–100 score is a relative index. A score of 100 means “the moment of peak popularity for this term, in this time range, in this region.” A 50 means half that peak. That’s it.
So a term can score 100 with a few thousand searches, while another term scores 40 on millions — because the index is normalized per term, per window. Comparing scores across two different charts is meaningless unless you put both terms in the same comparison.
What “Trending Now” actually measures
The Trending Now feed (the one that powers most “X is trending!” headlines) works differently from the classic explore graph. It surfaces terms with the sharpest acceleration — searches growing fastest relative to their own baseline — not the largest absolute volume.
That’s why an obscure athlete’s name can out-trend a presidential election on a random Tuesday. The election has enormous but steady volume; the athlete went from near-zero to everywhere in an hour. Trending is about the derivative, not the total.
It is the same mechanic behind most of the spikes we cover here. A single word like “Brewers” can own the feed for an evening because of one ninth-inning comeback in Los Angeles, while far bigger and steadier topics never move at all.
Three ways people misread trends
1. Confusing acceleration with size
“Searches for X are up 5,000%” sounds enormous — but 5,000% growth from 20 searches is 1,000 searches. Percentage growth from a tiny base is the oldest trick in the misleading-stats book. Always ask: up from what?
2. Ignoring the time window
A term can be “at its 5-year peak” while being far below its all-time high, simply because the chart defaults to a shorter range. Stretch the window before you conclude anything historic is happening.
3. Missing the ambiguity of the query itself
Search terms are just strings. A spike in “corona” in 2020 meant something very different than in 2019. Google’s topic entities (marked as “Topic” rather than “Search term”) disambiguate better than raw queries, and are usually the safer thing to cite.
How to spot a spike that actually matters
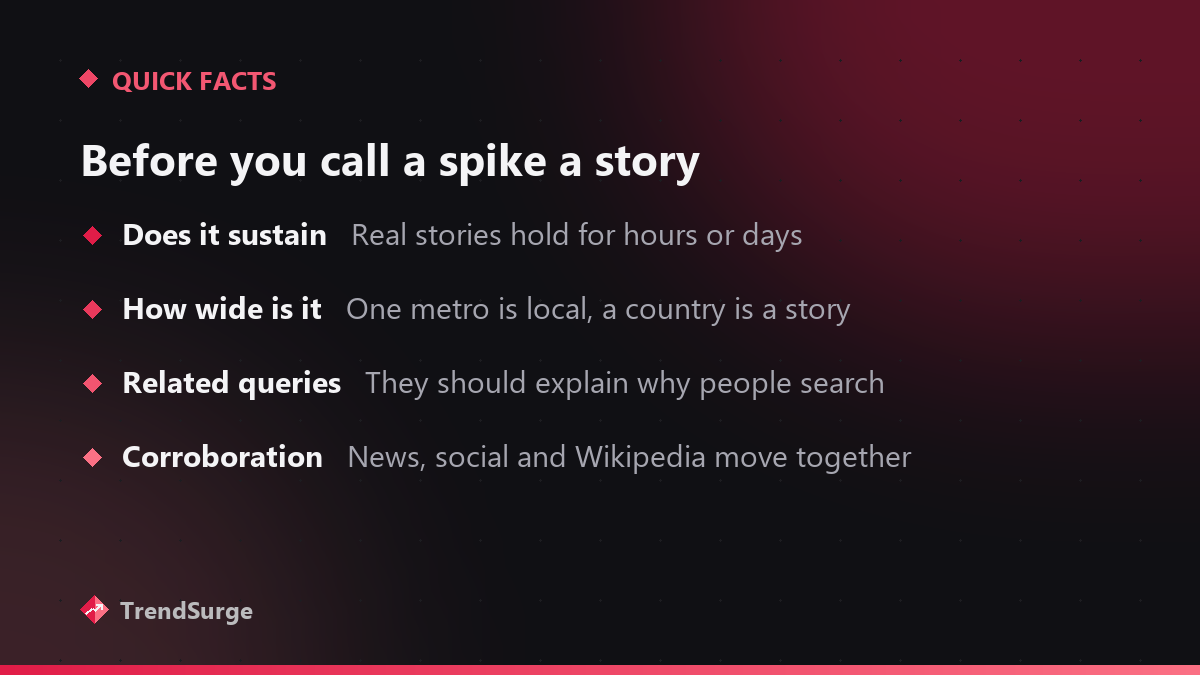
A useful mental checklist before treating any trend as a story:
- Does it sustain? Real stories hold attention for hours or days. Noise decays in under an hour.
- Is it geographically broad? A term trending in one metro area is a local event; trending across a country is a story.
- Do related queries explain it? The “related queries” panel usually tells you why people are searching — a TV mention, a death, a product launch. If the related queries are incoherent, be suspicious.
- Is there corroboration? If a term is genuinely surging, news coverage, social platforms, and Wikipedia page views usually move together.
A scheduled event is the easiest case to practice on. When Rockstar finally showed real gameplay in the GTA 6 Extended Look, the checklist should line up almost mechanically: the interest holds for days, it shows up everywhere at once, and the related queries resolve to obvious questions like the release date, the preorder price, and where to watch.
Why this matters more than it used to
Trend data has quietly become infrastructure. Newsrooms use it to decide coverage, advertisers to time campaigns, and financial analysts to estimate everything from retail demand to box-office openings. When the input is misread, those decisions inherit the error.
The data itself is good — Google samples billions of searches, which is a bigger behavioral dataset than any poll. The failures are almost always in interpretation: treating relative numbers as absolute, acceleration as size, and single-hour blips as movements.
Quick poll
What do you actually open Google Trends for?
Our take: whichever it is, remember what the number on screen is — a relative index, not a count of searches.
FAQ
Is Google Trends data real-time? The Trending Now feed updates continuously; classic Explore data has a short lag, and “realtime” views cover roughly the past week in hourly resolution.
Can Trends predict things? Sometimes — search interest often leads purchases, ticket sales, and even flu visits. But it predicts attention, not outcomes. People search for things they’d never buy or vote for.
Why do some terms show “Breakout” instead of a percentage? “Breakout” means the term grew more than 5,000% — usually because it had almost no baseline. It’s Google’s honest way of saying “growth from approximately zero.”